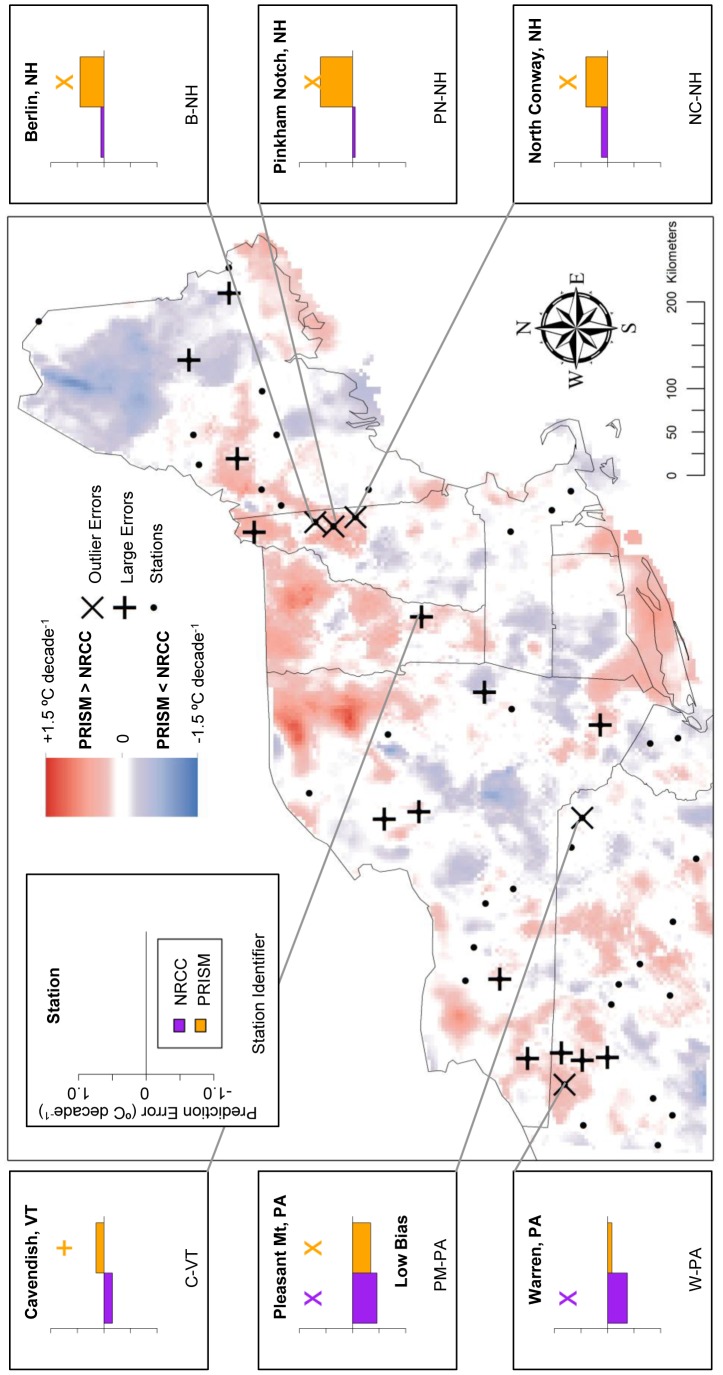
Figure 9. TMax Trend prediction error: Locations of large prediction errors.
Error locations are in relation to areas of locally high and low temperature differences (PRISM-NRCC). Inset graphs display associated prediction errors for both GHC products, with a cross above large prediction errors (above ±1 SD) and an ‘X’ above prediction error outliers (above ±2 SD). Each station has two prediction errors plotted: purple (NRCC) and orange (PRISM).

