
Figure 5. Mean proportion of total sensitivity to scalp, skull, and CSF as a function of source-detector separation.
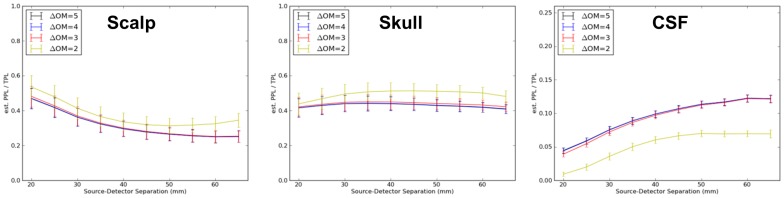
Errorbars represent standard errors across all nineteen locations in the International 10–20 System. Separate curves again represent pre-thresholding of the sensitivity (3-point Green's function) maps at 5, 4, 3 or 2 orders of magnitude (OM) reduction in sensitivity compared to peak.