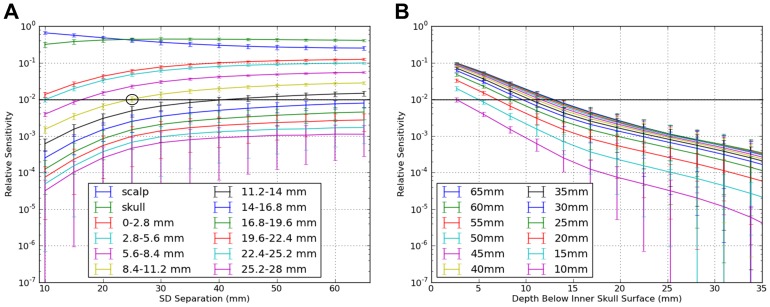
Figure 6. Mean NIRS depth sensitivity in the brain plotted in two orthogonal ways, by SD separation.
(A) The top two traces represent scalp (blue) and skull (green) sensitivity. Sensitivity to scalp and skull were equal at a SD separation of 25 mm. On average, 1% or more of the sensitivity profile was achieved for all of the most superficial 11.2 mm of the intracranial volume at SD separations of 25 mm or greater (circle). (B) Intracranial sensitivity in depth as a function of source-detector separation (excluding scalp and skull). At all separations, sensitivity decreases exponentially with depth (i.e., linear curves through ∼15 mm depth on this semilog plot).

