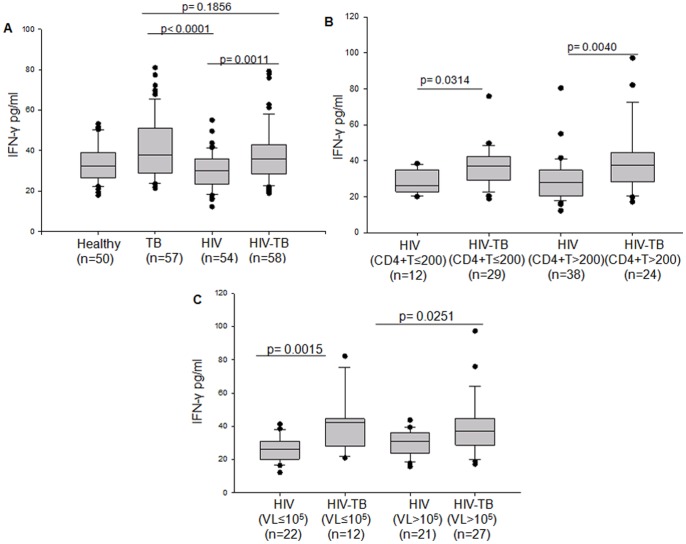
Figure 3. Plasma levels of IFN-γ in Healthy, TB, HIV and HIV-TB subjects and its relation to CD4+T cell and viral load under HIV and HIV-TB categories.
Box plots representing (A) comparison of plasma IFN-γ levels among Healthy, TB, HIV and HIV-TB categories. (B) Plasma levels of IFN-γ in HIV and HIV-TB patients categorized on the basis of low CD4+T cells (≤200/mm3) and high CD4+T cells (>200/mm3). (C) Plasma levels of IFN-γ for HIV and HIV-TB patients with low viral load (VL≤105 IU/ml) and high viral load (VL>105 IU/ml). The threshold for significance was set at p≤0.05. Bars above the plots represent the statistical significance (p value) between the groups.

