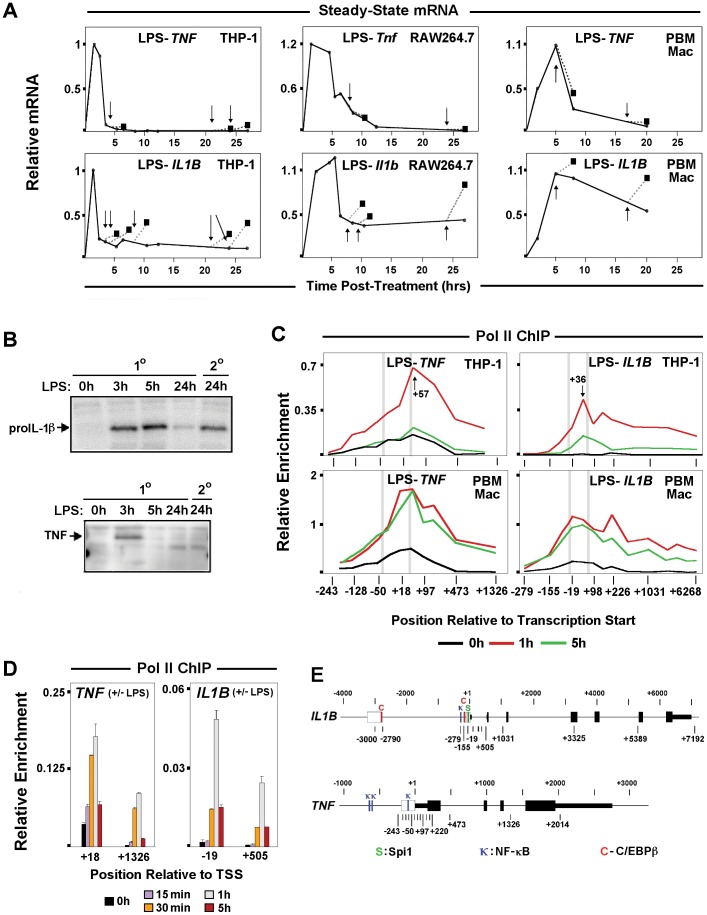
Figure 1. Comparison of IL1B and TNF expression in monocytes.
(A) Steady-state mRNA kinetics for IL1B and TNF transcripts in LPS stimulated THP-1, RAW264.7 and human peripheral blood mononuclear cells (hPBMC). Solid lines denote mRNA levels for primary LPS challenge. Squares show transcript levels following re-stimulation, as indicated by arrows. (B) Western blot for 30 KDa proIL-1β precursor protein. (C) Pol II ChIP throughout the IL1B and TNF loci in resting (black), 1 h (red) and 5 h (green) LPS stimulated THP-1, RAW264.7 and hPBMC cells. Vertical gray bars locate the positions of important gene landmarks. These include TATA box and the canonical Pol II pause position (approximately 30 bp upstream and 50 bp downsteam of TSS, respectively). (D) Pol II ChIP at promoter and downstream sites for IL1B and TNF. E. Schematic of IL1B and TNF gene structures showing exons (solid boxes), positions of ChIP amplicons (midpoint relative to TSS), and important transcription factor binding sites (C: C/EBPβ, κ: NF-κB and S: Spi1) within regulatory regions (open boxes).

