
Figure 5. Heat map analysis reveals a global view of genes up- and down-regulated in lungs between Day 1 and Day 3 post MRSA lung infection.
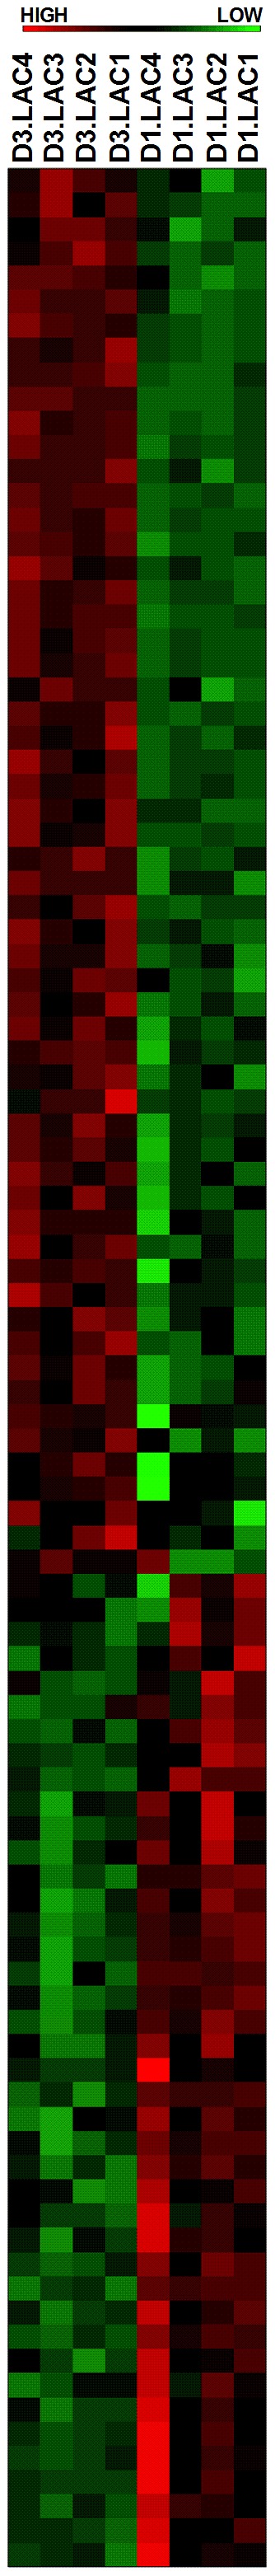
The 82 differentially expressed genes were used to construct this heatmap.
Official websites use .gov
A
.gov website belongs to an official
government organization in the United States.
Secure .gov websites use HTTPS
A lock (
) or https:// means you've safely
connected to the .gov website. Share sensitive
information only on official, secure websites.
The 82 differentially expressed genes were used to construct this heatmap.