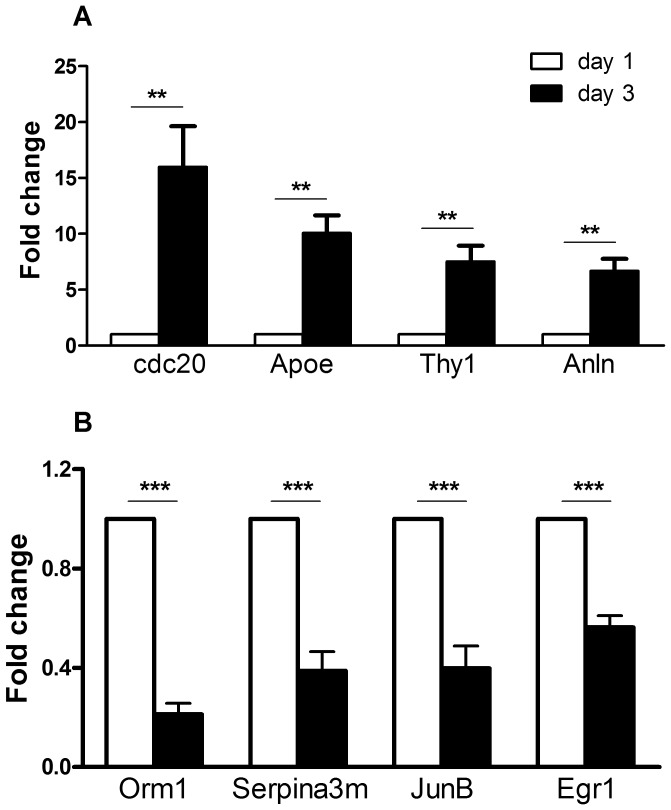
Figure 7. Real-time PCR validation of four up-regulated (A) and four down-regulated (B) genes revealed by microarray hybridization.
The y axis labeled “fold Change” is defined in the materials and methods section. Blank bars represent Day 1 and black bars represent Day 3. Results are represented as mean ± standard error from six independent experiments including the four experiments for microarray data analysis. Statistical analysis was performed using analysis of variance (ANOVA). ** p<0.01, ***p<0.001.

