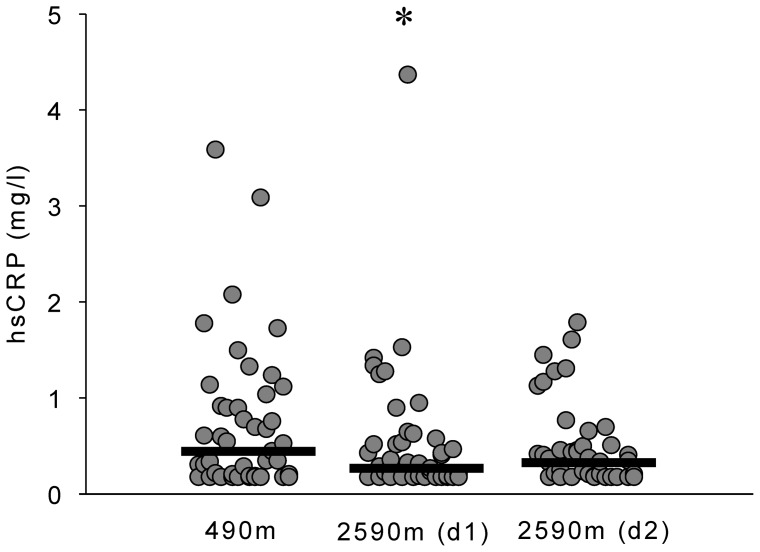
Figure 4. Effects of moderate altitude on C-reactive protein.
Scatterplot showing individual highly sensitive C-reactive protein (hsCRP) blood levels in Zurich (490 m) and Davos Jakobshorn (2590 m). Black lines represent medians. HsCRP levels were lower on day 1 at 2590 m compared to 490 m. *p<0.05 vs 490 m.

