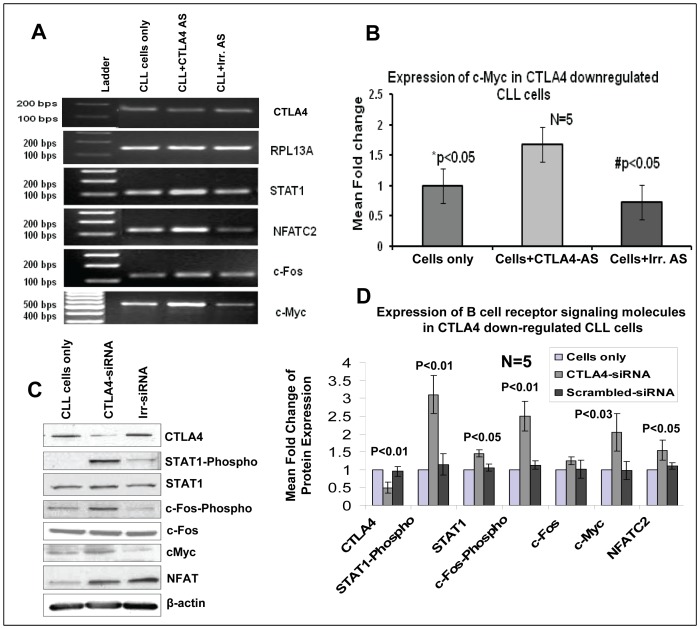
Figure 2. Upregulation of STAT1/phospho-STAT1, NFATC2, c-Fos/phospho-c-Fos, and c-Myc in CTLA4-downregulated CLL (low CD38/high CTLA4) cells as determined by RT-PCR, real-time PCR, and/or Western blotting.
Panels A: Semi-quantitative RT-PCR showing that downregulation of CTLA4 by AS in CLL cells leads to up-regulation of STAT1, NFATC2, c-Fos, and c-Myc in CLL. Panel B: Real-time PCR results from four patient samples showing a significantly higher expression of c-Myc in CTLA4-downregulated CLL cells compared to control CLL cells or CLL cells treated with irrelevant AS. Panel C–D: Western blot results showing up-regulation and quantification of the expression of STAT1 and its phosphorylation, c-Fos and its phosphorylation, NFATC2, and c-Myc at the protein level in CTLA4 down-regulated CLL patient samples (n = 3). *p indicates the statistical difference between control CLL cells and CTLA4-downregulated CLL cells. β-Actin was used as a control.

