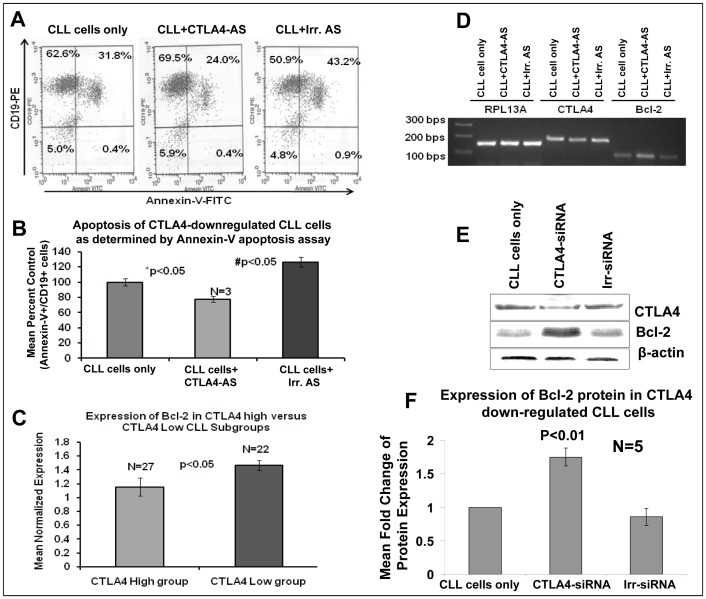
Figure 4. Measurement of apoptosis in CTLA4-downregulated low CD38/high CTLA4 CLL cells.
Panel A: Representative results showing the percentage of live, pre-apoptotic, and apoptotic cells in CTLA4-downregulated CLL cells as determined by flow cytometry. Panel B: Mean decrease in apoptotic cell frequency in CTLA4-downregulated CLL cells. The values are derived from primary CLL cells from three different patients using Annexin-V flow cytometry method. Panel C: Expression of Bcl-2 in the CTLA4-high and CTLA4-low subgroups as determined by microarray. Panels D: Expression levels of CTLA4 and Bcl-2 in CTLA4-downregulated CLL cells as determined by semiquantitative RT-PCR. RPL13A, a housekeeping gene, was used as a control. Panels E–F: Bcl-2 expression levels were measured using Western blot in CTLA4-downregulated CLL cells. Panel E: A representative figure for the upregulation of Bcl-2 protein. Panel F: Mean expression of Bcl-2 in (low CD38) patient samples (n = 3) treated with and without CTLA4-siRNA. β-Actin was used as a control.

