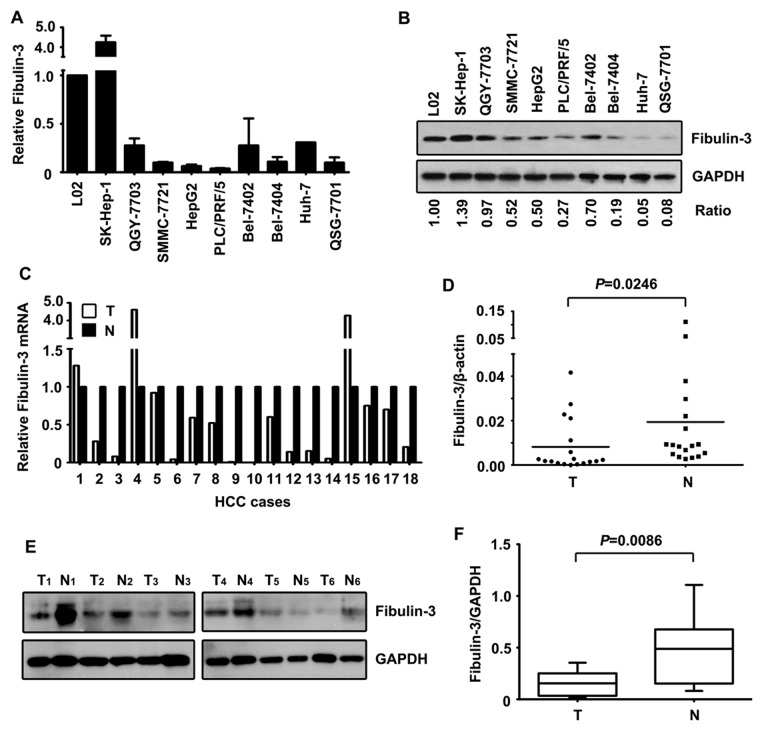
Figure 1. Expression of Fibulin-3 in HCC cell lines and fresh tissue samples by qRT-PCR and western blot.
A. The mRNA levels of Fibulin-3 in immobilized liver cell line (L02) and HCC cell lines were determined using qRT-PCR. B. Protein levels of Fibulin-3 in HCC cell lines were detected by western blot. The ratio of Fibulin-3/GAPDH was indicated below. C. The mRNA levels of Fibulin-3 in 18 pairs of HCC and corresponding adjacent liver samples were examined. Relative Fibulin-3 mRNA was presented. D. Significance of alteration of Fibulin-3 mRNA was revealed by Wilcoxon matched paired test. E. Expressions of Fibulin-3 protein in 18 paired tissues were examined by western blot. Representative images of Fibulin-3 expression were presented. F. Relative intensity of Fibulin-3 normalized to GAPDH was calculated (n = 18).

