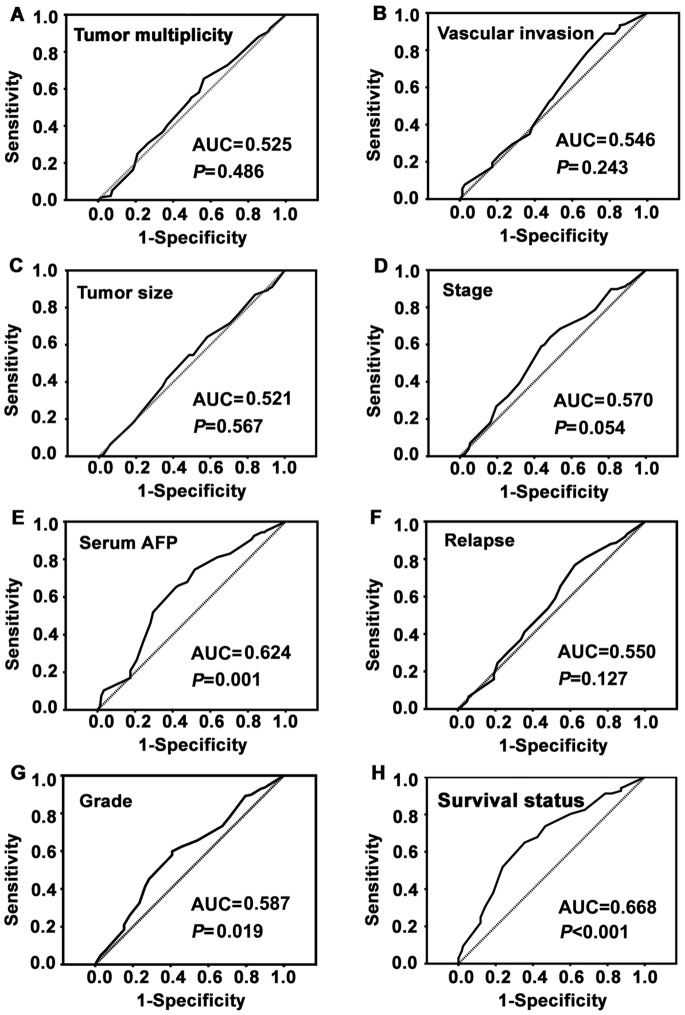
Figure 2. Determination of the cutoff value of low Fibulin-3 expression in HCC tissues by ROC curves.
The sensitivity and 1-specificity were plotted for each clinical feature, such as tumor multiplicity, tumor size, serum AFP, pathological grade, clinical stage, vascular invasion, relapse and survival status. The areas under the curve (AUCs) and the P values were indicated.

