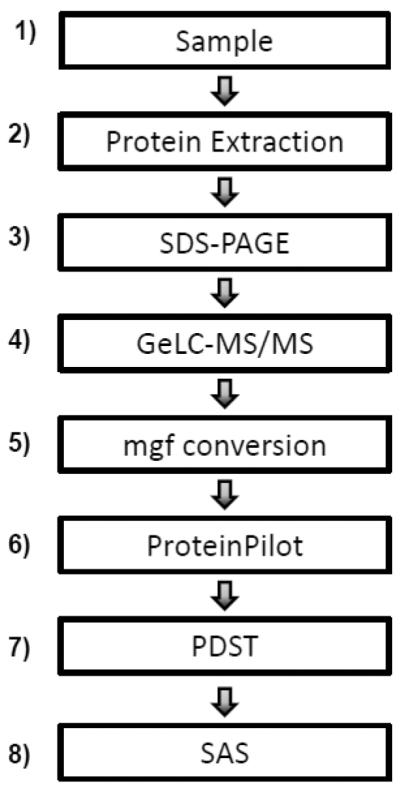
Figure 1. Experimental workflow.

1) Samples are collected. 2) Proteins are extracted from the sample, via chemical precipitation for body fluids and detergent extraction for cells. 3) Proteins are fractionated via SDS-PAGE. 4) Proteins are subjected to GeLC-MS/MS. 5) RAW files are converted to mascot generic files (mgf). 6) Database searching is performed using ProteinPilot. 7) ProteinPilot Descriptive Statistics Template (PDST) is used to tabulate PTMs. 8) SAS is used to determine the statistical significance of differentially identified PTM frequencies.
