
Figure 2.
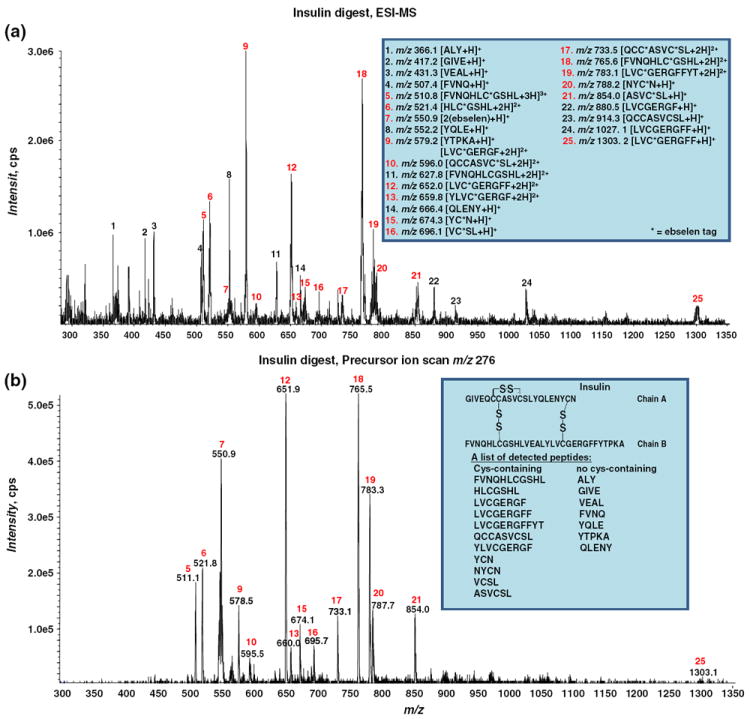
(a) ESI-MS mass spectrum showing the reaction of the reduced peptic digested insulin with ebselen. The inset shows the list of all the peptide peaks; (b) PIS based on the monitoring of the characteristic fragment ion of m/z 276 upon CID shows the selective detection of thiol peptides in the reduced peptic digested insulin. The insulin sequence and a list of detected cysteine-containing and non-cysteine containing peptides are shown in the inset