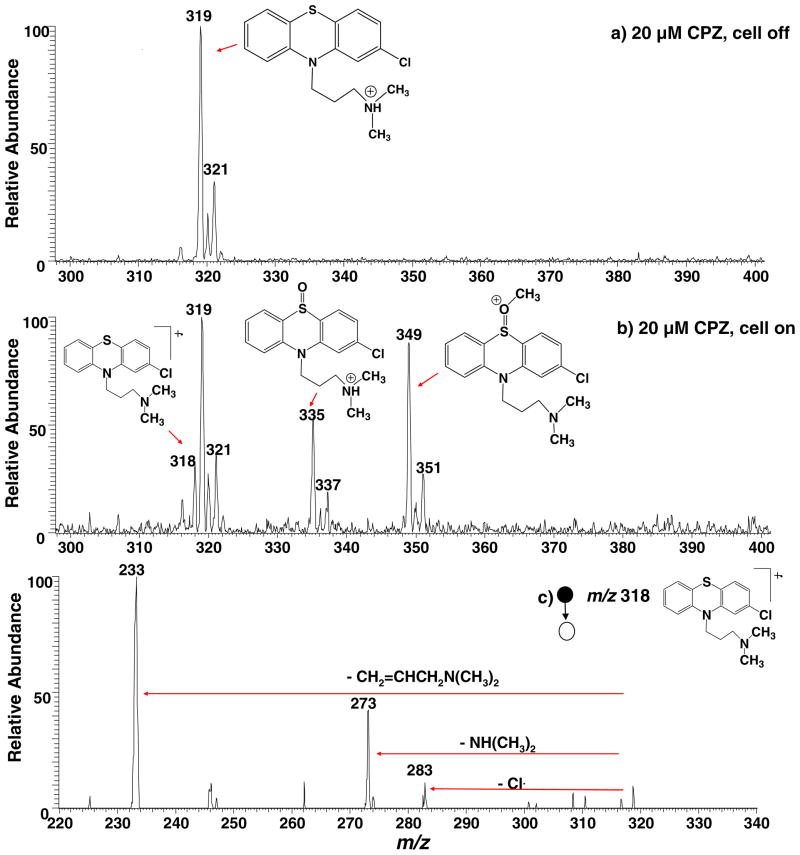
Fig. 4.
DESI-MS spectra acquired when a solution of 20 μM chlorpromazine in methanol/water (1:1 by volume) containing 0.5% formic acid flowed through the thin-layer electrochemical cell with an applied potential of (a) 0.0 V and (b) +1.5 V; (c) CID MS/MS spectrum of the chlorpromazine radical cation (m/z 318)

