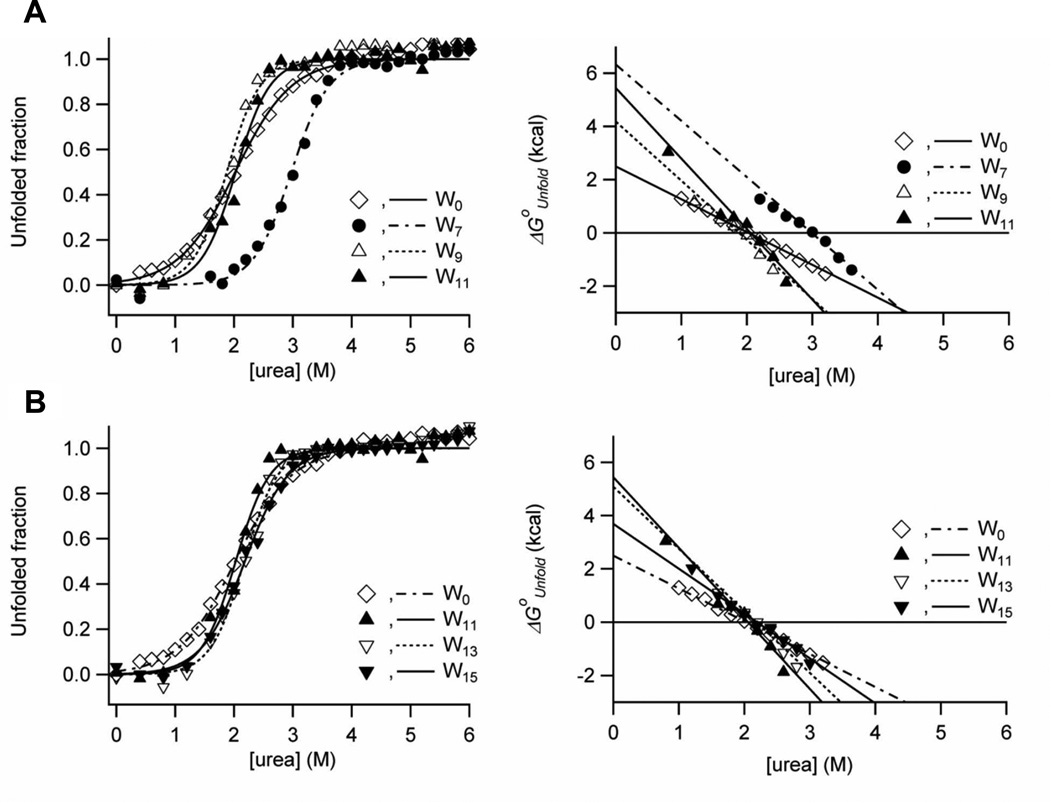
Figure 2.
Urea-induced equilibrium unfolding of OmpA mutants in DPoPC/POPG (9:1) lipid bilayers monitored by Trp fluorescence emission. (A) Unfolding transition curves for W0, W7, W9 and W11 mutants with Trps in the periplasm-facing monolayer (left) and corresponding plots of unfolding free energies versus urea concentration (right). (B) Unfolding transition curves for W0, W11, W13 and W15 mutants with Trps in the extracellular-space-facing monolayer (left) and corresponding plots of unfolding free energies versus urea concentration (right).

