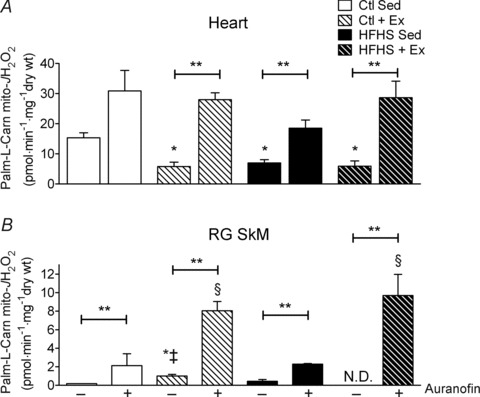
Figure 3. Thioredoxin reductase-2 (TxnRd2) and mitochondrial ROS supported only by fatty acid in cardiac and skeletal muscle following HFHS diet and/or exercise.

Rates of mitochondrial H2O2 emission (mito- ) supported by palmitoyl-l-carnitine in state 3 (i.e. phosphorylating) conditions in the absence and presence of the TxnRd2 inhibitor auranofin are shown for cardiac (A) and red gastrocnemius skeletal muscle (B). Data are shown as means + SEM, n= 5–8 per group. *P < 0.05 vs. Ctl Sed (–auranofin), ‡P < 0.05 vs. HFHS + Ex (–auranofin), §P < 0.05 vs. Ctl + HFHS Sed (+auranofin) and **P < 0.05 indicates main effect of auranofin within group.
