
Figure 5. Redox and anti-inflammatory gene expression in cardiac and skeletal muscle following HFHS diet and/or exercise.
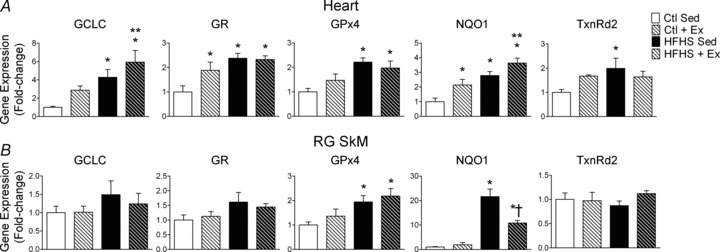
Relative differences in mRNA are shown for the target genes indicated above each panel for cardiac (A) and red gastrocnemius skeletal muscle (B) among all four experimental groups. Data are shown as means + SEM, n= 8–9 per group. *P < 0.05 vs. Ctl Sed, **P < 0.05 vs. Ctl + Ex, †P < 0.05 vs. HFHS Sed.