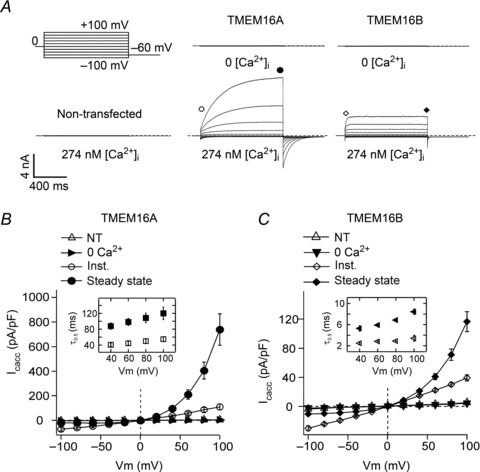
Figure 1. Whole-cell TMEM16A and TMEM16B currents.

A, whole-cell currents recorded from a non-transfected HEK-293T cell or HEK-293T cells expressing TMEM16A or TMEM16B in the presence of 0 or 274 nm[Ca2+]i, as indicated. Dashed horizontal lines represent the zero-current level. Voltage protocol is shown in the upper left panel. B, mean whole-cell current density versus voltage relationships measured at the beginning (Inst.) or at the end (Steady state) of 1 s voltage pulses from −100 to +100 mV in 20 mV increments for HEK-293T cells expressing TMEM16A in the presence of 274 nm[Ca2+]i (n= 7). Mean whole-cell currents obtained from non-transfected (NT) HEK-293T cells ([Ca2+]i= 274 nm) (n= 5), and from transfected cells in 0 [Ca2+]i (n= 5) were measured only at the end of the pulse. C, mean whole-cell current density versus voltage relationships for TMEM16B (n= 8). Experimental conditions as described in B. Insets in B and C show mean τ0.5 of current activation (filled symbols) and deactivation (open symbols) for TMEM16A and TMEM16B, measured in the presence of 274 nm[Ca2+]i at various membrane potentials (n= 7–8).
