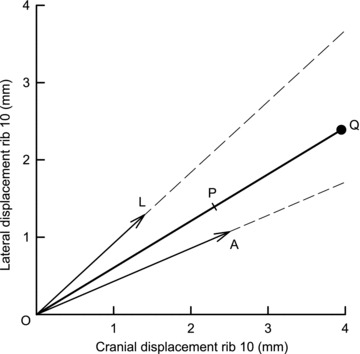
Figure 2. Comparison between the trajectory of rib 10 during spontaneous breathing and the trajectories during the application of external forces.

Data are from the same animal as in Fig. 1. The continuous line O–Q corresponds to the rib trajectory driven by transdiaphragmatic pressure (ΔPdi) alone for Pdi= 5 cmH2O, and the dashed lines correspond to the rib trajectories obtained during the application of external forces to the rib in the lateral and cranial–dorsal directions. These two trajectories are the relationships shown in Fig. 1 but transposed so as to pass through the origin. The lines O–A and O–L are the vectors along these trajectories that are the components of the resultant O–Q, and the point P was defined by drawing through point A the normal to O–Q. The segment O–P, therefore, was taken as the rib displacement contributed by the insertional force, and the segment P–Q was taken as the displacement contributed by the appositional force.
