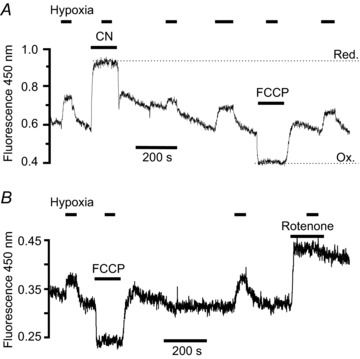
Figure 1. NADH autofluorescence in type-1 cells.

Recording of autofluorescence at 450 nm with 340 nm excitation from two small clusters of type-1 cells. Note increase in fluorescence in response to electron transport inhibition with 2 mm cyanide (A) and 1 μm rotenone (B), and decrease in fluorescence with 1 μm FCCP (A and B). The mitochondrial NAD+/NADH couple is assumed to be maximally oxidised in the presence of FCCP, i.e. all in the form of NAD+ which is non-fluorescent, and any remaining signal under these conditions is therefore assumed to come from some other source. In the presence of cyanide the mitochondrial NAD+/NADH couple is assumed to be maximally reduced, i.e. all in the form of NADH. The difference in fluorescence between the maximally reduced and oxidised states (Red & Ox in A) therefore represents total mitochondrial NADH + NAD+. Note that hypoxia (2.5% oxygen) increases fluorescence under control conditions but not in the presence of CN, rotenone or FCCP, indicating that hypoxia increases mitochondrial NADH but does not affect other sources of cellular fluorescence.
