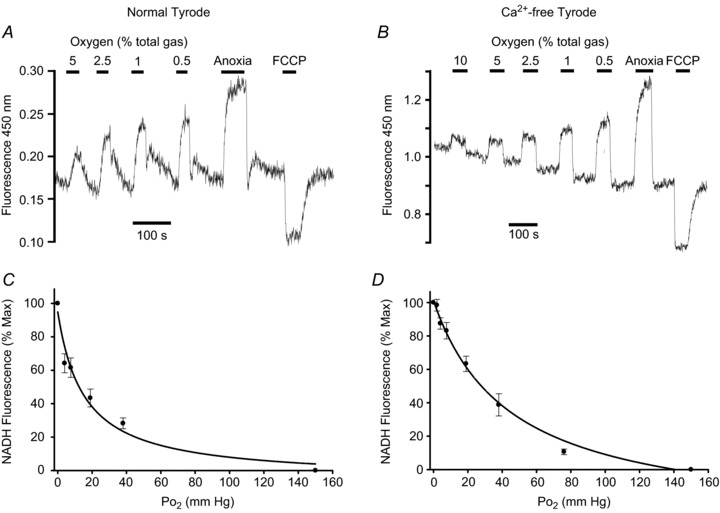
Figure 2. Effects of graded hypoxia on NADH autofluorescence in type-1 cells.

Recordings of autofluorescence at 450 nm with 340 nm excitation showing effects of graded levels of hypoxia from 5/10% down to anoxia. A and B, original recordings. C and D, normalised summary data (mean ± SEM) from 9 (C) and 11–17 (D) recordings with best fit rectangular hyperbola. The recording and graph on the left (A and C) were obtained in a normal Tyrode containing 2.5 mm Ca2+; the recording and graph on the right (B and D) were obtained in a Ca2+-free Tyrode containing 100 μm EGTA. Note rapid effects of hypoxia at all levels.
