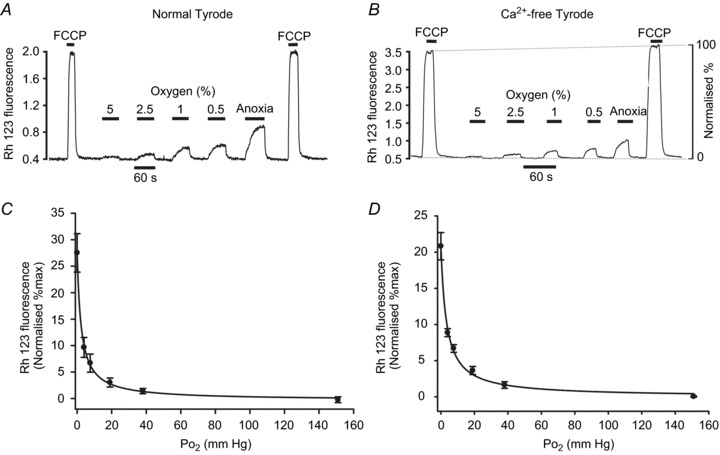
Figure 4. Effects of hypoxia on mitochondrial membrane potential in type-1 cells.

Measurements of mitochondrial membrane potential were performed using rhodamine 123 (see Methods). A, original recording from a small type-1 cell cluster conducted in normal Tyrode. B, similar recording obtained in Ca2+-free Tyrode containing 100 μm EGTA. Hypoxia ranged from 5% O2 down to anoxia. Note application of FCCP (1 μm) causes rapid increase in fluorescence as Rh123 is released from mitochondria due to depolarisation of ψm. Depolarisation is assumed to be complete in 1 μm FCCP. Effects of hypoxia were measured on a 0–100% scale where 0%= interpolated baseline fluorescence in 20% O2 and 100%= interpolated maximum fluorescence in 1 μm FCCP. C and D, normalised summary data (mean ± SEM) from 11 recordings with best fit rectangular hyperbola (see Results for details) for normal Tyrode (C) and Ca-free Tyrode (D).
