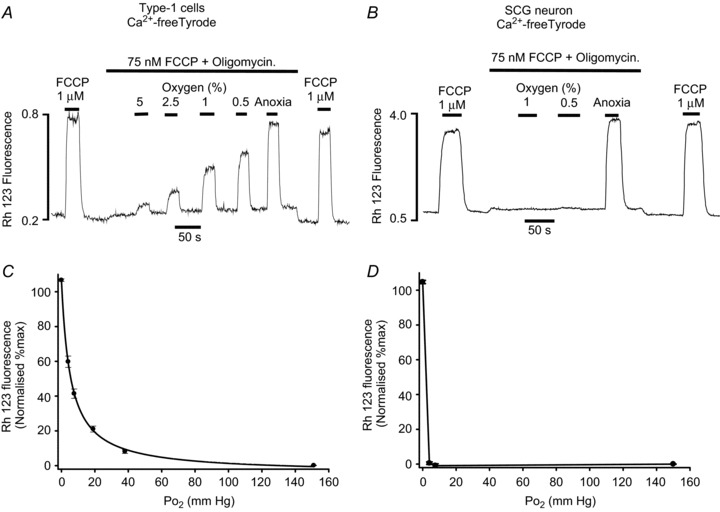
Figure 5. Effects of hypoxia on electron transport.

Measurements of mitochondrial membrane potential were performed using rhodamine 123. A and B, original recordings conducted in Ca2+-free Tyrode containing 100 μm EGTA. Type-1 cells (A) or SCG neurons (B) were exposed to a low level of FCCP (75 nm) and oligomycin (2.5 μg ml−1) to inhibit ATP synthase and partially uncouple the mitochondria (see text). The effects of hypoxia were then tested in the presence of FCCP and oligomycin. The effect of hypoxia was assessed on a 0–100% scale where 0%= interpolated baseline fluorescence in 20% O2, 75 μm FCCP + oligomycin and 100%= interpolated maximum fluorescence in 1 μm FCCP (applied as a brief pulse before and after each experiment). C, normalised summary data (mean ± SEM) from 12 recordings obtained in single and small clusters of type-1 cells with best fit rectangular hyperbola (see Results for details). D, normalised summary data (mean ± SEM) from 7 recordings obtained in single SCG neurons. Data points in D are joined by straight lines only.
