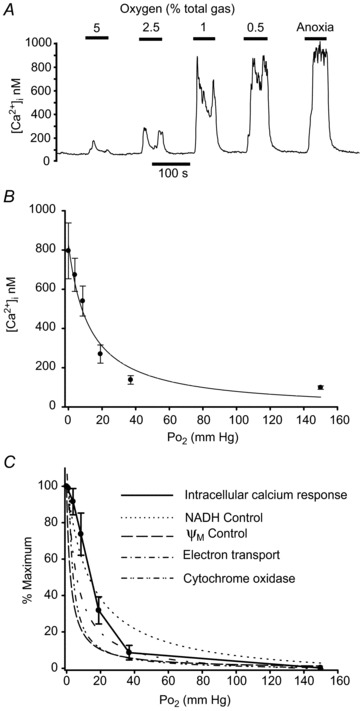
Figure 7. Oxygen sensitivity of calcium signalling and mitochondrial function.

A, original recording of intracellular Ca2+ concentration measured using Indo-1 in a small cluster of type-1 cells bathed in normal Tyrode. Cells are exposed to graded hypoxic stimuli from 5% oxygen down to anoxia. B, summary data (mean ± SEM) from 11 recordings as in A. Curve is a rectangular hyperbola fitted to these data (see text for details). C, effects of hypoxia on a relative scale of 0–100% where 0%= baseline [Ca2+]i recorded in 20% O2 and 100%= maximal [Ca2+]i recorded in anoxia. These data (mean ± SEM) are joined by straight lines only. Curves represent oxygen sensitivity of various measures of mitochondrial function in the form of hyperbolic functions fitted to the original data, including: NADH from Fig 2C, ψm from Fig 4C (both in normal Ca2+ Tyrode), electron transport from Fig. 5C and cytochrome oxidase activity from Fig. 6C. Hyperbolas have been rescaled, where necessary, to a 0 (baseline in 20% O2) to 100% (maximum in anoxia) scale.
