
Figure 4. Minimum and peak MU firing rates as a function of respiratory effort.
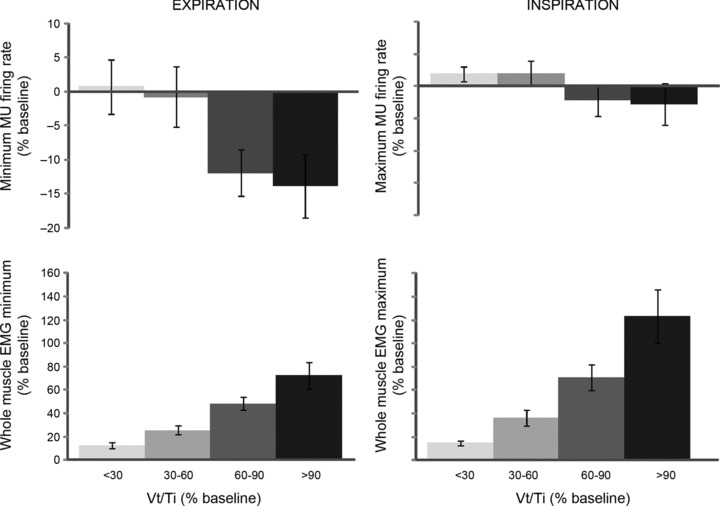
Group data depicting minimum (i.e. expiration) and peak (i.e. inspiration) MU firing rates as a function of respiratory effort level (Vt/Ti, % baseline) (top most plots). Values represent average interspike intervals derived from 46 single MUs calculated over 10 breaths at each workload. Lower plots depict the change (% baseline) in minimum (expiratory) and peak (inspiratory) components of whole muscle GG EMG as a function of mean inspiratory flow (Vt/Ti, % baseline). Values represent group averages calculated over 10 breaths at each workload.