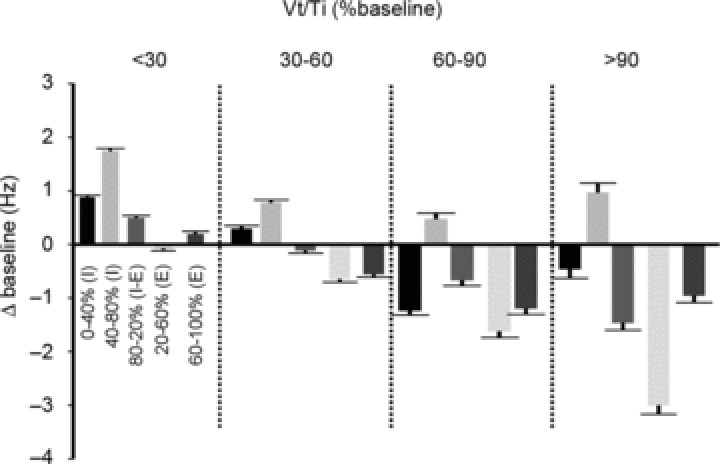
Figure 7. Change in MU firing frequency as a function of breath phase at each respiratory effort level.

Group data depicting the average (SE) change in MU firing frequency (Hz) as a function of breath phase at each respiratory effort level (Vt/Ti). Values represent MU firing rates for each of five phases of the breath corresponding to inspired (I) and expired (E) volumes: 0–40% (I); 40–80% (I); 80–20% (I–E); 20–60% (E); 60–100% (E), and at each respiratory effort level (i.e. <30, 30–60, 60–90 and >90%).
