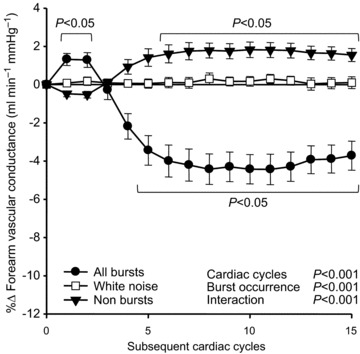
Figure 1. Summary data of beat-by-beat percentage changes in forearm vascular conductance following all muscle sympathetic nerve activity bursts (filled circles), non-bursts (filled triangles) and white noise (open squares).

Brackets denote significant difference from percentage changes in white noise. Values are means ±s.e.
