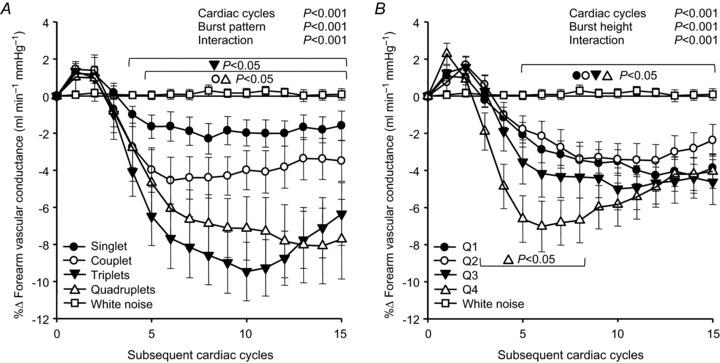
Figure 2. Summary data of beat-by-beat percentage changes in forearm vascular conductance (FVC) following variations in spontaneous muscle sympathetic nerve activity (MSNA) burst pattern and size.

A, changes in FVC following consecutive MSNA bursts of increasing length (singlet, couplet, triplet and quadruplet). B, changes in FVC following MSNA bursts divided into quartiles of increasing size (Q1–Q4, respectively). White noise changes are provided for reference (open squares). Brackets denote significant difference from percentage changes in white noise. Values are means ±s.e.
