
Figure 3. Confocal FRAP data of Alexa-CTxB, YFP-GL-GPI, Flot-1-RFP, DiIC16, and EGFP.
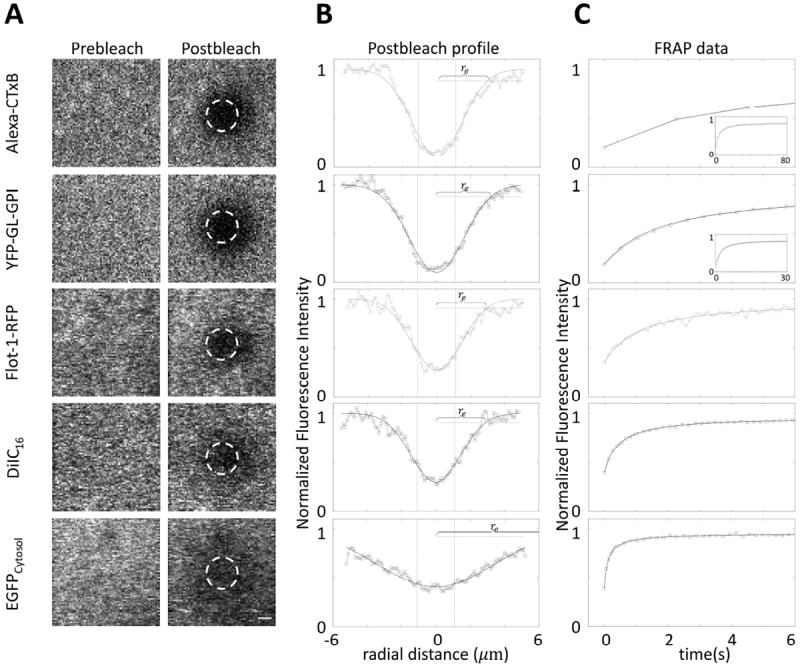
(A) Representative pre- and post-bleach images. Dashed circles represent user-defined bleaching spots with diameter 2.2 μm (i.e. rn= 1.1 μm). To speed data acquisition for the FRAP analysis, we cropped the imaging window to make it slightly larger than the bleaching spot size. Scale bar, 1 μm. (B) Averaged postbleach profiles for N=12~14 cells along the diagonals of postbleach images (□) and the best fitting Gaussian (Eq. 2, —). Dotted vertical lines show x=±rn (user defined bleach ROI). Dash-dot horizontal lines are 14% of bleaching depth from the top. (C) Representative FRAP recovery curves (□) and the best fit to Eq. 3 (—). Insets show full FRAP curves for Alexa-CTxB and YFP-GL-GPI. In (B) and (C), y- axes are normalized fluorescence intensities, i.e. Fi = 1. Since the bleach ROI is slightly off center in our system, a correction was made to determine re as described in the Materials and Methods.