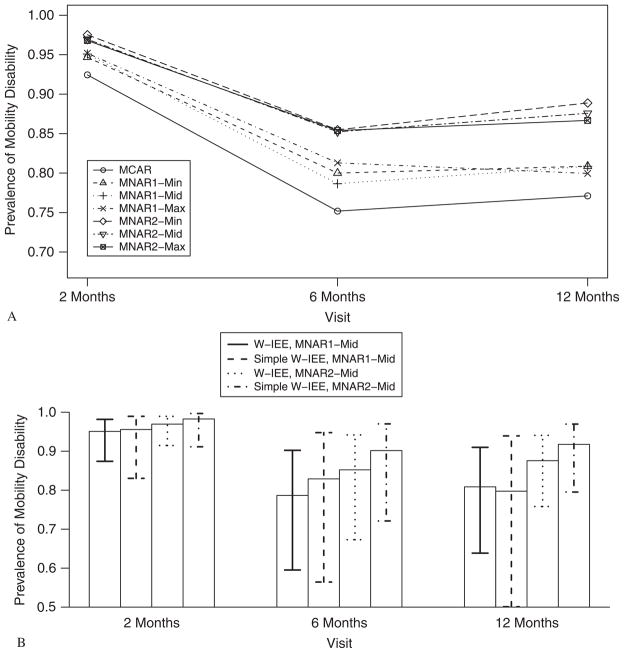
Figure 2.
BHS-3 results. Panel A: estimated prevalence of walking disability (P(Y = 1)) at 2, 6, and 12 months post-fracture for MCAR (IEE) and six MNAR (W-IEE) mechanisms. Panel B: estimated prevalence and 95 per cent confidence interval of walking disability (P(Y = 1)) at 2, 6, and 12 months post-fracture for MNAR1-mid and MNAR2-mid mechanisms from W-IEE and simple W-IEE. Min, mid, and max of , (−log(1.50), −log(1.75), log(1.25)), and (−log(2.00), −log(2.50), log(1.50)), respectively.

