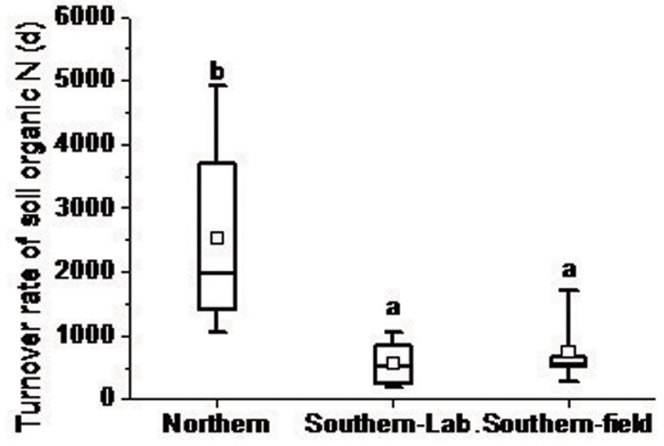
Figure 1. Box-whisker plot of turnover rates for organic N in northern and southern forest soils.
In each box, there are five horizontal lines. From bottom to top, the lines represent the minimum, the middle number for the first half of the data set, the middle number for the whole list, the middle number for the second half of the data set, and the largest value, respectively. The square in each box is the average turnover rate. Identical letters indicate no significant difference. Southern-Lab denotes gross N transformation rates that were determined by laboratory incubation; Southern-field denotes gross N transformation rates that were determined by field incubation.

