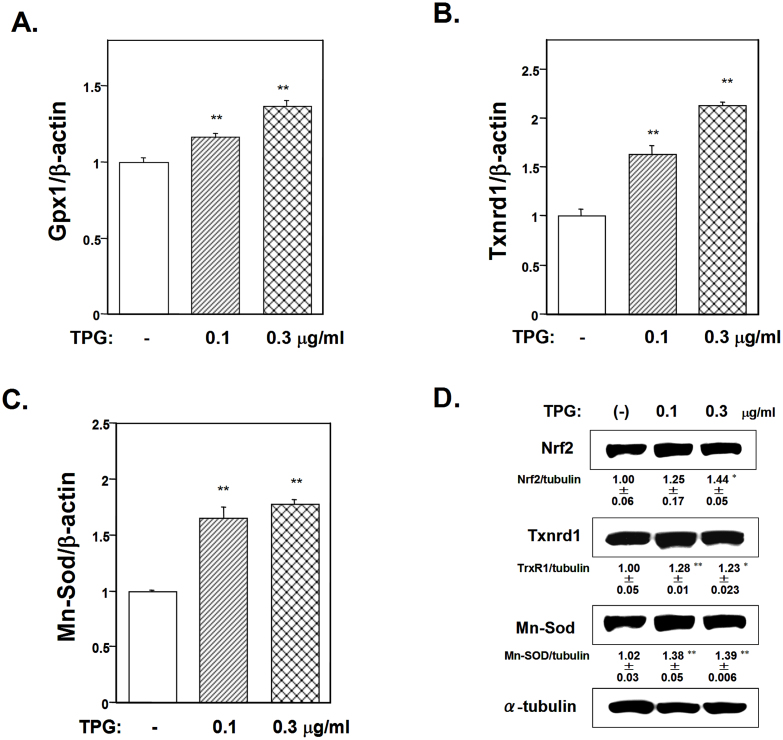
Figure 3. Effect of pretreatment with TPG on the expression of antioxidants in C2C12-DMPK160 cells.
Expression of Gpx1 (A), Txnrd1 (B), and Mn-Sod (C) mRNA was analyzed by quantitative real-time PCR. Total RNA was extracted from cells treated with 0.1 or 0.3 μg/ml TPG for 16 h. The histogram depicts the indicated mRNA normalized to β-actin. Values shown are means ± SE of 4 separate experiments.**Significantly different from TPG-untreated cells by a one-way ANOVA (**p < 0.01). (D) Western blot analyses of Nrf2, Txnrd1, and Mn-Sod. Western blots of C2C12-DMPK160 cells pretreated with 0.1 or 0.3 μg/ml TPG for 16 h were analyzed with the indicated antibody probes. The densitometric quantification of each protein was normalized to α-tubulin and is represented as fold increase over the non-pretreated cells. Although cropped blots were used, the gels were run under the same experimental conditions. Representative images of 3 samples are shown with quantitative data (means ± SE). *, **Significantly different from TPG-untreated cells by a one-way ANOVA (*p < 0.05, **p < 0.01).

