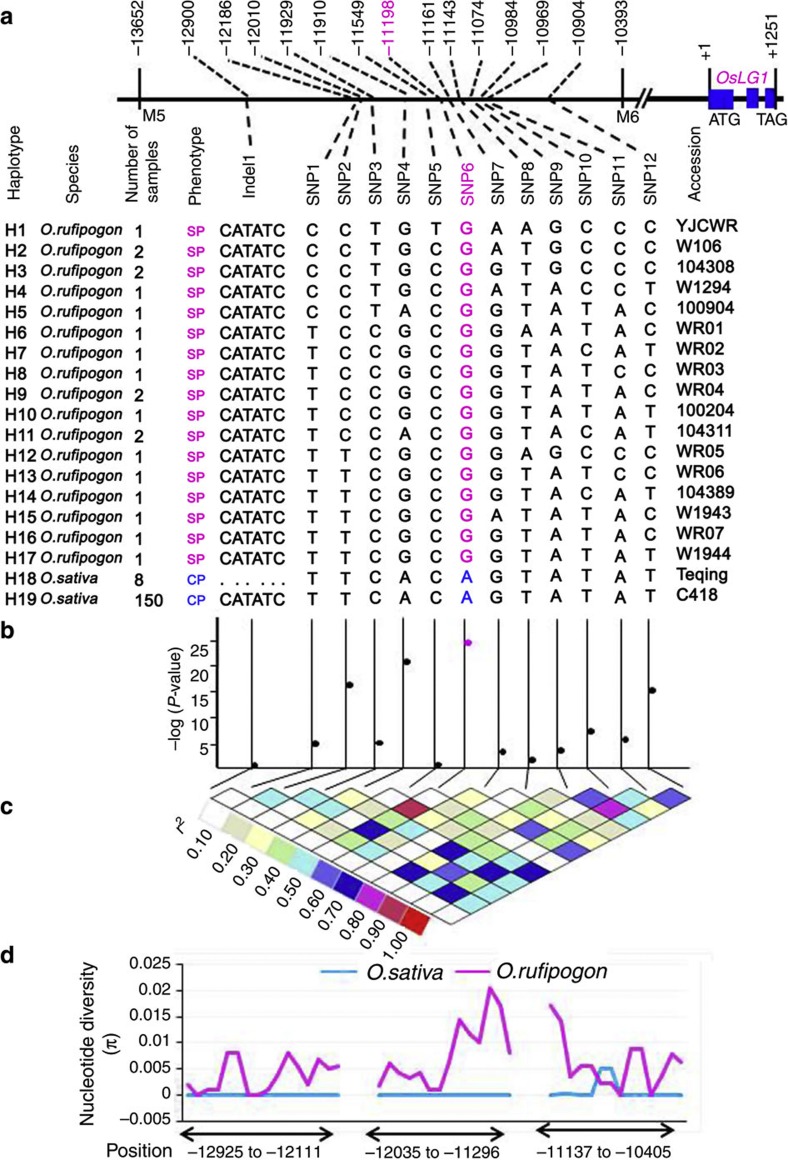
Figure 3. Haplotype analysis and association mapping in the 3.3-kb upstream regulatory region of OsLG1.
(a) Haplotype analysis of the 3.3-kb upstream regulatory region with 21 accessions of wild rice and 158 domesticated cultivars. SP, spread panicle; CP, compact panicle. (b) Association testing of 13 variants in the 3.3-kb finely mapped region of OsLG1. Black dots represent 12 variations; pink dot represents the proposed functional variant site (SNP6). (c) Triangle matrix of pairwise linkage disequilibrium. (d) The comparison of nucleotide diversity (π) between wild and cultivated rice. The position is the physical position immediately upstream of the translation start site of the OsLG1 gene.

