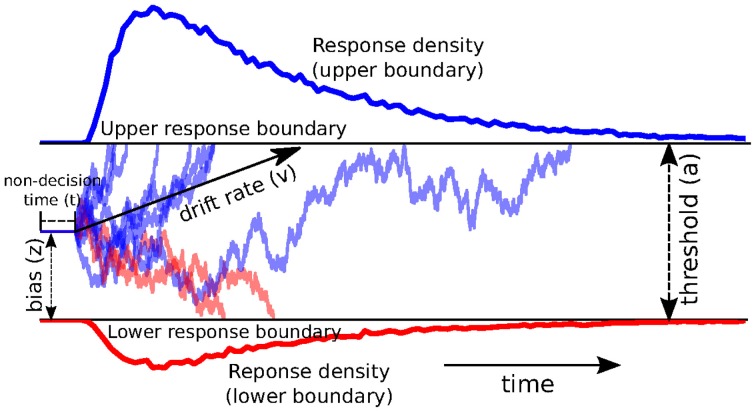
Figure 1.
Trajectories of multiple drift-processes (blue and red lines, middle panel). Evidence is noisily accumulated over time (x-axis) with average drift-rate v until one of two boundaries (separated by threshold a) is crossed and a response is initiated. Upper (blue) and lower (red) panels contain density plots over boundary-crossing-times for two possible responses. The flat line in the beginning of the drift-processes denotes the non-decision time t where no accumulation happens. The histogram shapes match closely to those observed in response time measurements of research participants. Note that HDDM uses a closed-form likelihood function and not actual simulation as depicted here.

