
Figure 4.
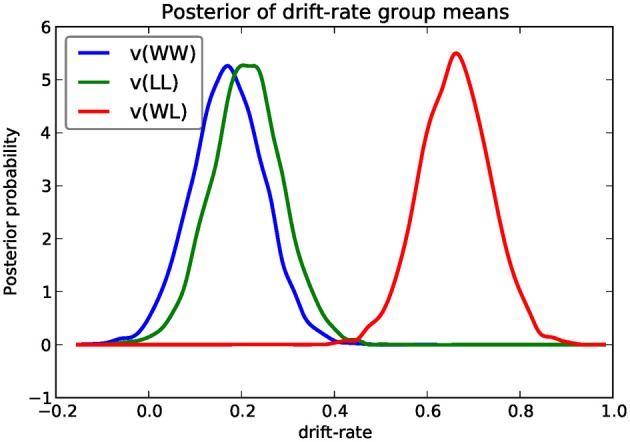
Posterior density plot of the group means of the 3 different drift-rates v as produced by the hddm.analyze.plot_posterior_nodes() function. Regions of high probability are more credible than those of low probability.
Official websites use .gov
A
.gov website belongs to an official
government organization in the United States.
Secure .gov websites use HTTPS
A lock (
) or https:// means you've safely
connected to the .gov website. Share sensitive
information only on official, secure websites.
Posterior density plot of the group means of the 3 different drift-rates v as produced by the hddm.analyze.plot_posterior_nodes() function. Regions of high probability are more credible than those of low probability.