
Figure 7.
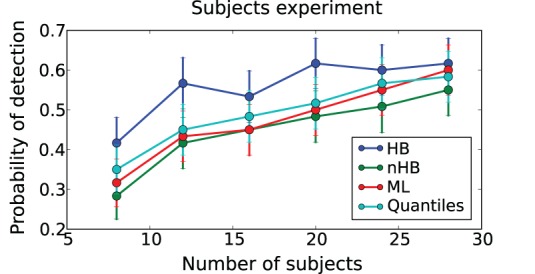
Subjects experiment. Probability of detecting a drift-rate difference (y-axis) for different numbers of subjects (x-axis) and different estimation methods (color coded; HB, Hierarchical Bayes; nHB, non-hierarchical Bayes; ML, maximum likelihood; and Quantiles, χ2-Quantile method). HB together with Bayesian hypothesis testing on the group posterior results in a consistently higher probability of detecting an effect.