
Figure 8.
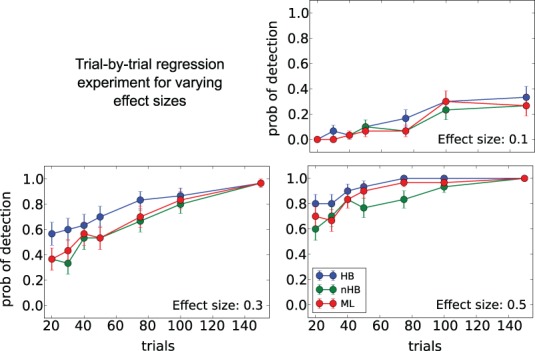
Trial-by-trial covariate experiment. Probability of detecting a trial-by-trial effect on drift-rate (y-axis) with effect-sizes 0.1 (top left plot), 0.3 (bottom left plot) and 0.5 (bottom right plot) for different estimation methods (color coded; HB, Hierarchical Bayes; nHB, non-hierarchical Bayes; ML, maximum likelihood). While there is only a modest increase in detection rate with the smallest effect size, HB provides an increase in detection rate of up to 20% with larger effect sizes and fewer trials.