
Figure 1.
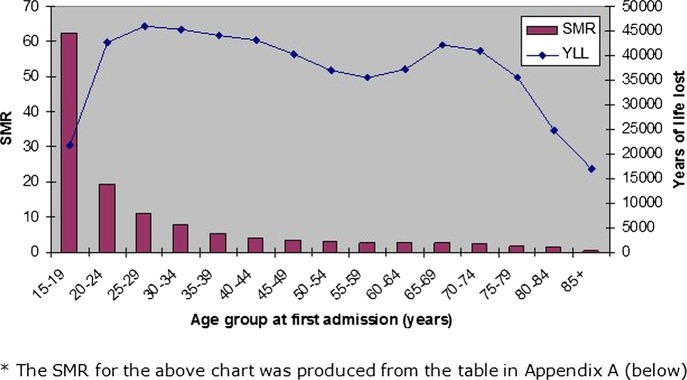
All-cause standardised mortality ratios and overall years of life lost for patients diagnosed 1986–2009 and followed up until 31 December 2010 by age group at first admission.
Official websites use .gov
A
.gov website belongs to an official
government organization in the United States.
Secure .gov websites use HTTPS
A lock (
) or https:// means you've safely
connected to the .gov website. Share sensitive
information only on official, secure websites.
All-cause standardised mortality ratios and overall years of life lost for patients diagnosed 1986–2009 and followed up until 31 December 2010 by age group at first admission.