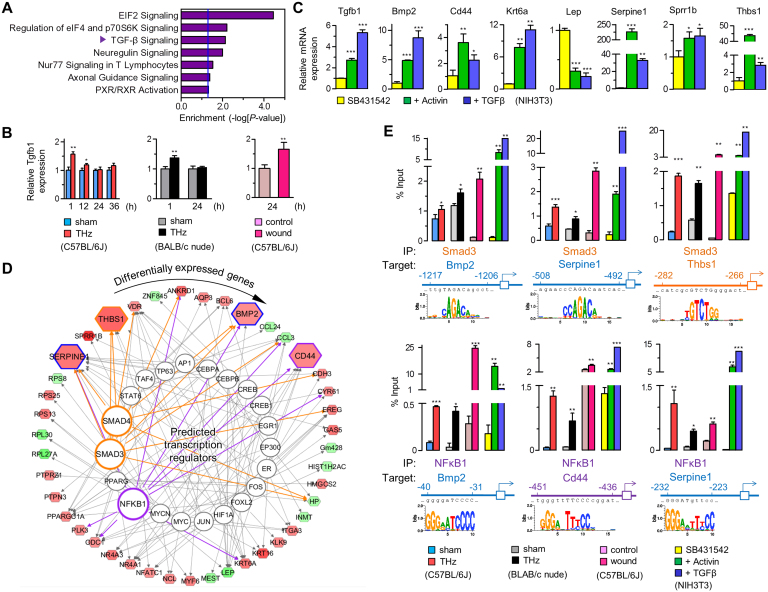
Figure 3. Induction of TGF-β and transcriptional control of wound response.
(A) Enrichment analysis of DEGs in signaling pathways. The vertical blue line indicates acceptable significance (P = 0.05). “TGF-β Signaling” was analyzed as the most dominant pathway followed by pathways relating to translation initiation. (B) Expression of Tgfb1, by real-time RT-PCR, in skin from THz-irradiated C57BL/6J, BALB/c nude mice, and in an in vivo wound model. (C) Expression of wound response genes by real-time RT-PCR, in TGF-β-treated NIH 3T3 cells (each, n ≥ 3). (D) in silico mapping of the transcriptional regulation for DEGs. Analyzed TFs targeting mRNAs out of database (alphabetized clockwise in outer circle) are placed clockwise from top (12:00) in inner circle (See Table S3 for more detailed information). Smad3 and NFκB1 are highlighted. (E) Identification for TFBSs of the targeted genes regulated by Smad3 and NFκB1. Expression of target genes measured by ChIP-qPCR, in skin from THz-irradiated C57BL/6J and BALB/c nude mice, from an in vivo wound model, and in TGF-β-treated NIH3T3 cells. (B, C and E, Mean ± SD. *, P<0.05; **, P<0.01; ***, P<0.001).

