
Figure 5.
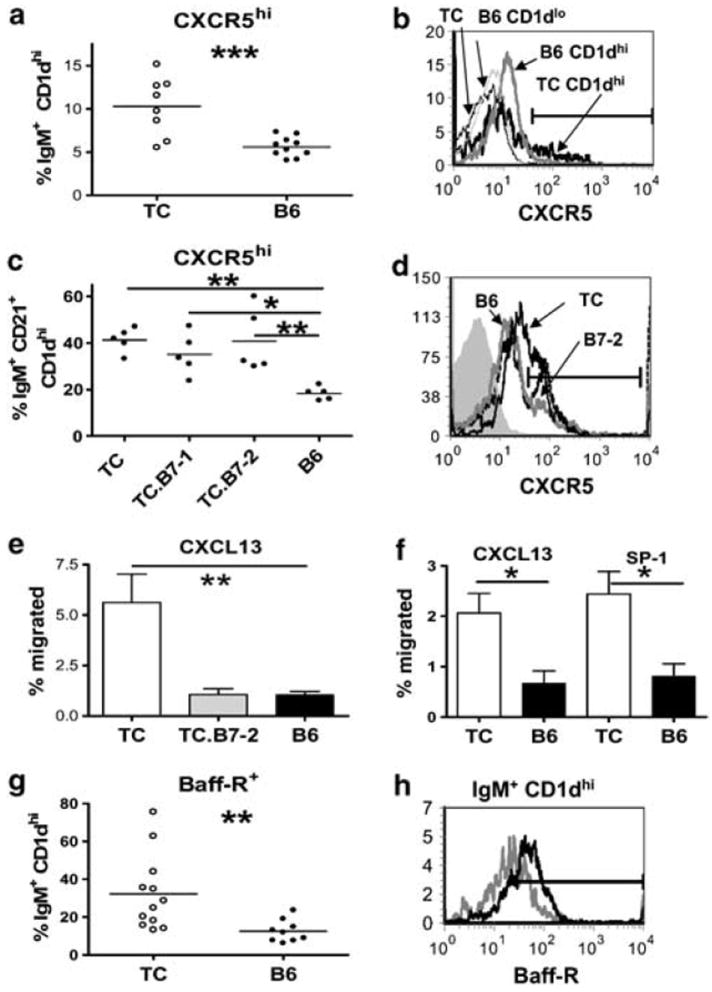
B6.TC MZ B cells showed an increased response to CXCL13 and S1P. (a) CXCR5hi expression on IgM+ CD1dhi-gated MZ B cells. (b) Representative histograms of CXCR5 expression on IgM+ CD1dhi MZ B cells (thick lines) and IgM+ CD1d− non-MZ B cells (thin lines) in B6 (gray histograms) and B6.TC (black histograms) mice. (c) CXCR5hi expression on IgM+ CD21+ CD1dhi-gated MZ B cells from B6.TC, B6.TC.B7-1−/−, B6.TC.B7-2−/−, and B6 mice. (d) Representative histograms of CXCR5 expression on IgM+ CD21+ CD1dhi MZ B cells in B6 (gray) and B6.TC (heavy black) and mice B6.TC.B7-2−/− (thin black). The filled gray histogram shows the CXCR5 isotype control. (e) Percentage of IgM+ CD1d+ B cells from B6.TC (white), B6.TC.B7-2−/− (gray), and B6 (black) mice that migrated to CXCL13. (f) Percentage of IgM+ CD1d+ B cells from B6.TC (white) and B6 (black) mice that migrated to CXCL13 or S1P. (c and d) Means and s.e. of four mice per groups. (g) BAFF-R expression on IgM+ CD1d+-gated MZ B cells with representative histograms for B6.TC (black) and B6 (gray) shown in (h). The position of the marker for positive staining was based on the isotype control. *P<0.05, **P<0.01, ***P<0.001. (a, f, g) t-Tests, (c and e) Dunnett’s multiple comparison test with B6 as controls.