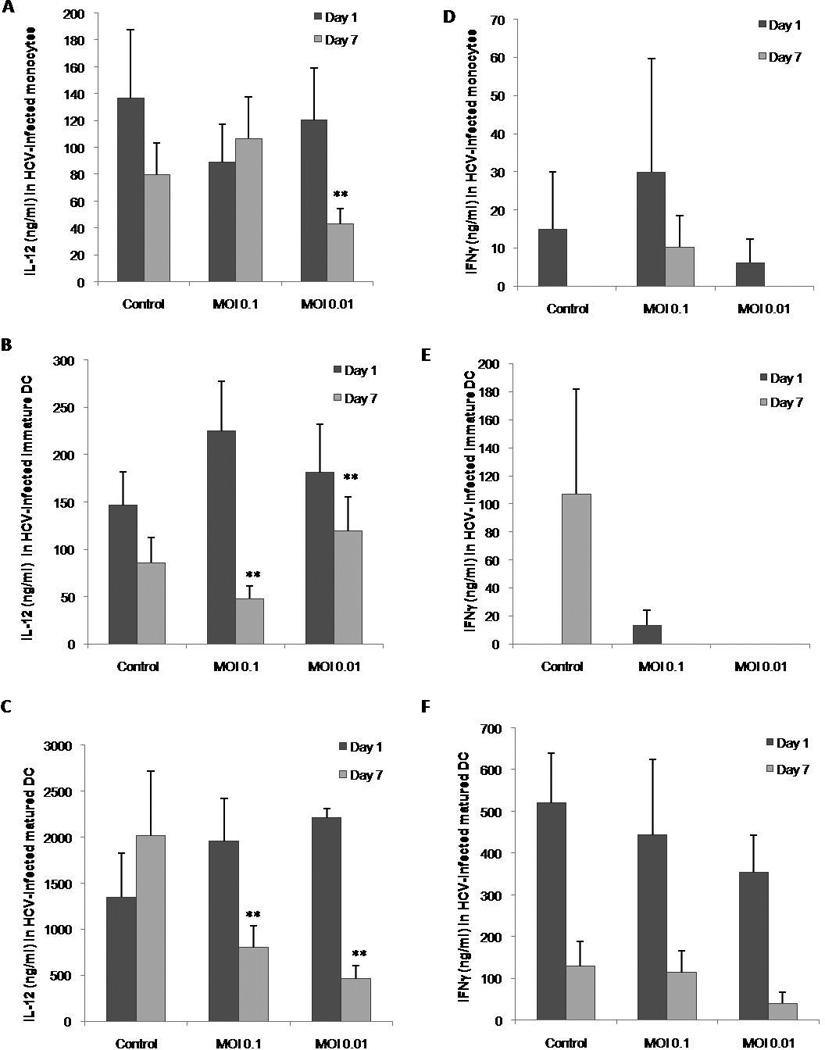
Figure 5. Concentration of TH1 cytokines IL-12 and IFNγ produced by monocytes and DC after HCV infection.

Supernatant from monocyte, immature DC or mature DC cultures with or without HCV were collected at 1 and 7 days post infection and analyzed by capture ELISA. A) Concentration of IL-12 produced by monocytes. B) Concentration of IL-12 produced by immature DCs. C) Concentration of IL-12 produced by mature DCs. D) Concentration of IFNγ produced by monocytes. E) Concentration of IFNγ produced by immature DCs. F) Concentration of IFNγ produced by mature DCs. Bars represent the standard error (SEM) of three separate experiments (three separate donors). * represents the significance of the comparison between the day 7 control and the test in a paired student t-test where p<0.05. ** represents the significance of the comparison between the day 7 control and the test in a paired student t-test where p<0.05.
