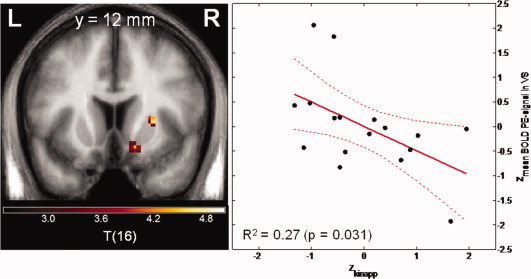
Figure 3.

Negative correlation between dopamine synthesis capacity as assessed in vivo with FDOPA PET and the BOLD prediction error signal in the ventral striatum. Left panel: Voxel‐by‐voxel association between FDOPA K and BOLD prediction error signal from the Biological Parametric Mapping analysis. Coronal slice at MNI coordinate y = 12, statistical threshold t > 3.0, minimum cluster size =20 voxels). Right panel: Plot of z‐standardized mean K value derived from the right VS VOI and mean BOLD prediction error signal derived from the right ventral striatal VOI. [Color figure can be viewed in the online issue, which is available at wileyonlinelibrary.com.]
