
Figure 4.
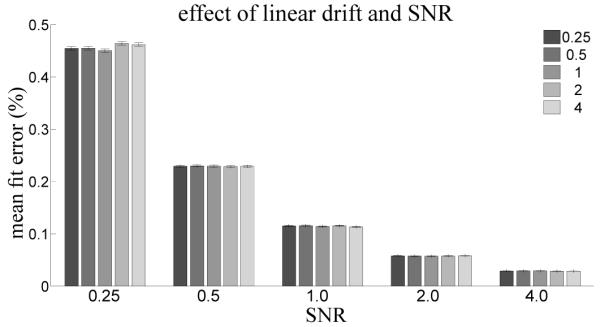
Effect of manipulating the strength of white noise and linear drift in the synthetic fMRI timeseries on the error in model reconstruction between post-hoc and incremental GLM fits. The strength of linear drift in % signal change is indicated by bar color, as shown in the legend. Error bars indicate standard error over the 1000 synthetic timeseries.