
Figure 5.
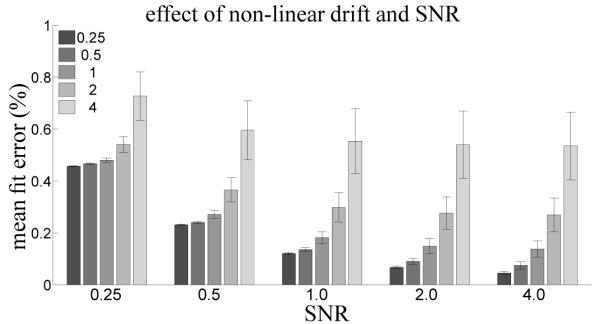
Effect of manipulating the strength of non-linear drift in the synthetic fMRI timeseries. Bar color indicates % signal change of the drift. Error bars indicate standard error over the mean error from each of the 6 different drift signals.
Official websites use .gov
A
.gov website belongs to an official
government organization in the United States.
Secure .gov websites use HTTPS
A lock (
) or https:// means you've safely
connected to the .gov website. Share sensitive
information only on official, secure websites.
Effect of manipulating the strength of non-linear drift in the synthetic fMRI timeseries. Bar color indicates % signal change of the drift. Error bars indicate standard error over the mean error from each of the 6 different drift signals.