Fig. 1.
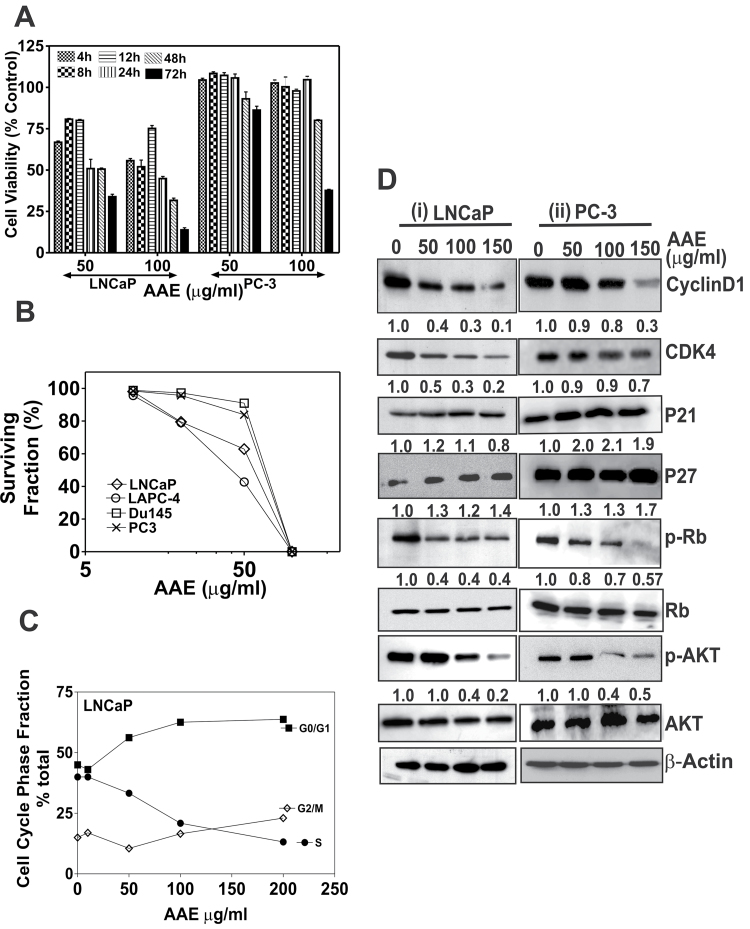
AAE inhibits CaP cell proliferation, clonogenic survival and cell cycle progression. (A) Cytotoxicity of AAE on CaP cells in time-dependent manner. LNCaP and PC-3 cells were exposed to AAE for different time points. The time points used were 4, 8, 12, 24, 48 and 72 h. Cell viability was determined by MTT reduction assay, after incubation time points. Mean ± SEM (n = 5), data normalized to control. (B) Colony-forming assay of CaP cells treated with AAE. Cells from each of the four CaP cell lines were plated in replicate (3–5/concentration) in 35mm culture dishes at 500–5000 cells per dish and were incubated with AAE for 7–10 days with media changes every 3 days. Emergent colonies of surviving cells were stained with 0.1% crystal violet. Colonies containing ≥16 cells were manually counted with a hand-held counter (16). Data presented as surviving fraction (% of control) was calculated as a ratio of mean number of colonies at each AAE concentration to that of untreated cultures. Error bars are not shown for clarity. Standard deviations (SD) for all cell lines were always ≤10%. (C) AAE inhibits cell cycle progression from G1 to S phase in LNCaP cells. Cells cultured in 35mm dishes in complete medium were treated with various concentrations of AAE for 24 (Supplementary Table S1, available at Carcinogenesis Online) or 48 h, lysed in a hypotonic buffer containing propidium iodide dye (50 µg/ml) to make suspensions of dye-labeled nuclei. The DNA content of individual nuclei was analyzed on a Epics XL flow cytometer (Beckman-Coulter, Miami, FL) followed by analyzing the cell cycle fractions of the DNA histograms using a software as described previously (16). Data are shown for one experiment. Similar results were obtained in replicate experiments. (D) AAE affects cell cycle regulatory molecules; cell lysates from LNCaP and PC-3 cultures treated with AAE for 24 h were analyzed by immunoblotting. Level of each of the proteins (bands in each row) was normalized to that of untreated control (not against β-actin) as cytotoxicity was not observed in the first 24h. In addition to cell cycle regulatory molecules, levels of p-AKT were analyzed in treated culture samples. The band intensity was normalized to that of β-actin (loading control) and relative expression of each protein was compared with that of control (untreated) samples that are indicated in numbers below the bands.

