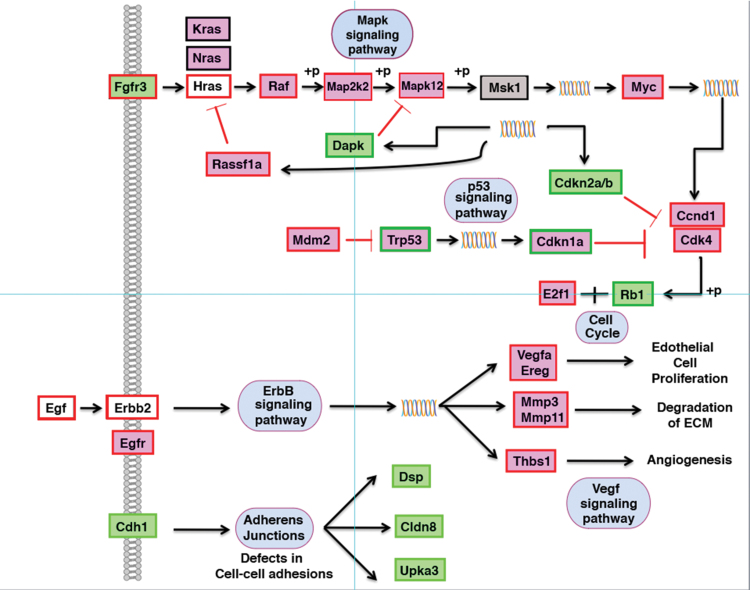
Fig. 6.
Comparison of gene expression changes in human bladder cancer and our mouse model based on KEGG pathway analysis. The information derived from the gene expression analysis of the transformed bladder cell lines has been superimposed onto the human KEGG pathway display. Red border, genes upregulated in human; green border, genes downregulated. Pink boxes, genes upregulated in mouse; green boxes, genes downregulated in mouse. No shading, no change in expression of this gene in mouse; gray shading, gene was not on the array. The majority of genes deregulated in human bladder cancer is also deregulated in the mouse model for bladder cancer (Myc, Mdm2, Ccnd1, Cdkn2a/b, Rb1, etc.) and followed the same directionality as the human genes.

