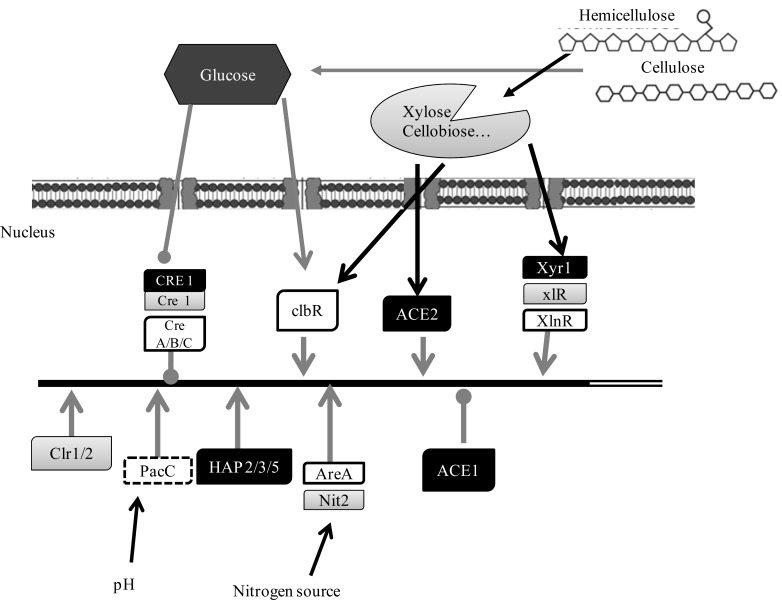
Fig. (1).
Schematic representation of transcriptional factors affecting cellulases and xylanases expression in T. reseei (black box), N. crassa
(grey box) and Aspergillus spp. (white box). The carbon catabolite repressor CRE, the activators clbR, Xyr/xlR/XlnR,Clr,ACE2, the repressor
ACE1, the CCAAT binding Hap2/3/5 complex, the pH regulator PacC, and the nitrogen regulators AreA and Nit2 are shown. The repression
activity ( ), the induction activity (
 ) and also promoter (
 ) and coding region (
 ) are indicated.

