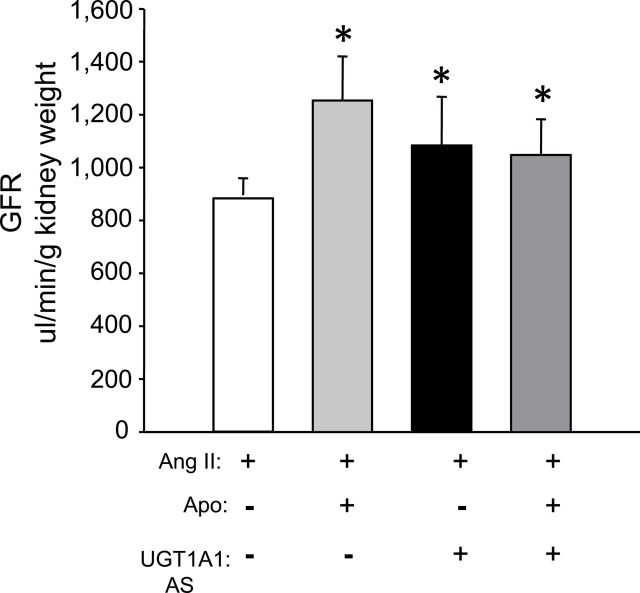
Figure 3.
Glomerular filtration rate (GFR) in angiotensin II (Ang II)–, Ang II + apocynin (Apo) –, Ang II + UDP-glucuronosyltransferase 1A1 (UGT1A1) antisense (AS)–, and Ang II + Apo + UGT1A1 AS–treated mice. GFR was measured on days 8 and 9 after Ang II administration by steady-state infusion of fluorescein isothiocyanate (FITC)-labeled inulin (10.5mg/min). Plasma samples (50ml) were obtained by retro-orbital bleeding. Levels of FITC-labeled inulin in plasma were measured from 5ml of plasma by a fluorescence based assay. n = 4 per group. * P < 0.05 as compared with Ang II.

