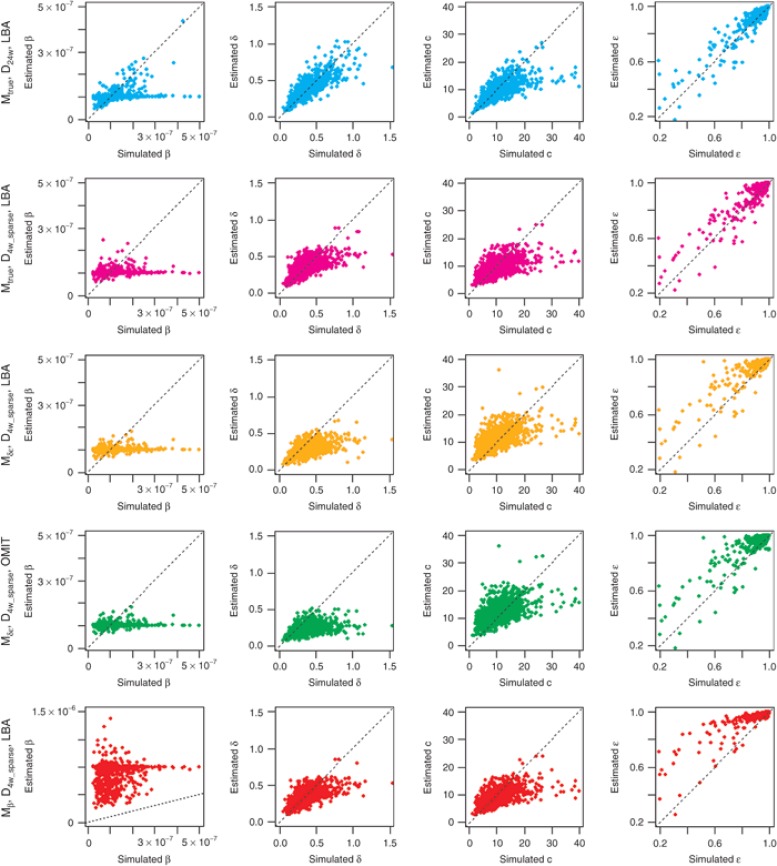
Figure 1.
Scatter plots of estimated values vs. simulated values for β, δ, c, ε under five selected cases (top to bottom): Mtrue_D24w_LBA, Mtrue_D4w_sparse_LBA, Mδε _D4w_sparse_LBA, Mδε _D4w_sparse_OMIT, and Mβ _D4w_sparse_LBA. The dotted line is the identity line. Lower left corner graph has a different scale on the y-axis compared to the other plots as in this scenario, β was fixed at a value that was 10 times higher than the true value to estimate individual parameters.

